Measure to Empower: Unleashing the Potential of Data in Social Causes
Know about how to use your data in an effective way.
Why should NGOs do data analysis?

🚀 Improved Decision-Making
Enhances resource allocation and program planning effectiveness.
💡 Increased Transparency
Real-time dashboards provide updates on project metrics and finances.
🌐 Efficient Monitoring and Evaluation
Visualizing impact data demonstrates program effectiveness to stakeholders.
💰 Facilitated Fundraising
Demonstrates tangible results to build trust and encourage donor support.
Case study
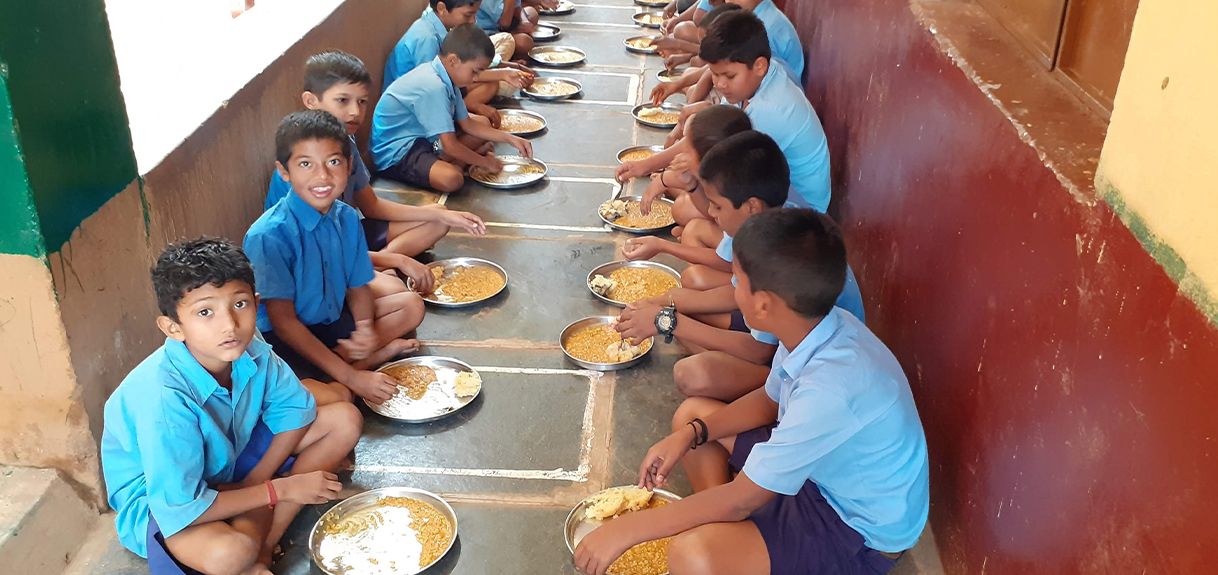
Akshaya Patra
This is a Bengaluru-based NPO which strives to eliminate classroom hunger by organizing mid-day meal schemes in government schools. As of now, they serve about 2 million children from over 14,000 schools across 12 states. With growing numbers, the Akshaya Patra is using data analytics efficiently to serve the children and make productive use of their funds. Data analytics is helping them in solving logistic problems like figuring out the optimum route to deliver food.
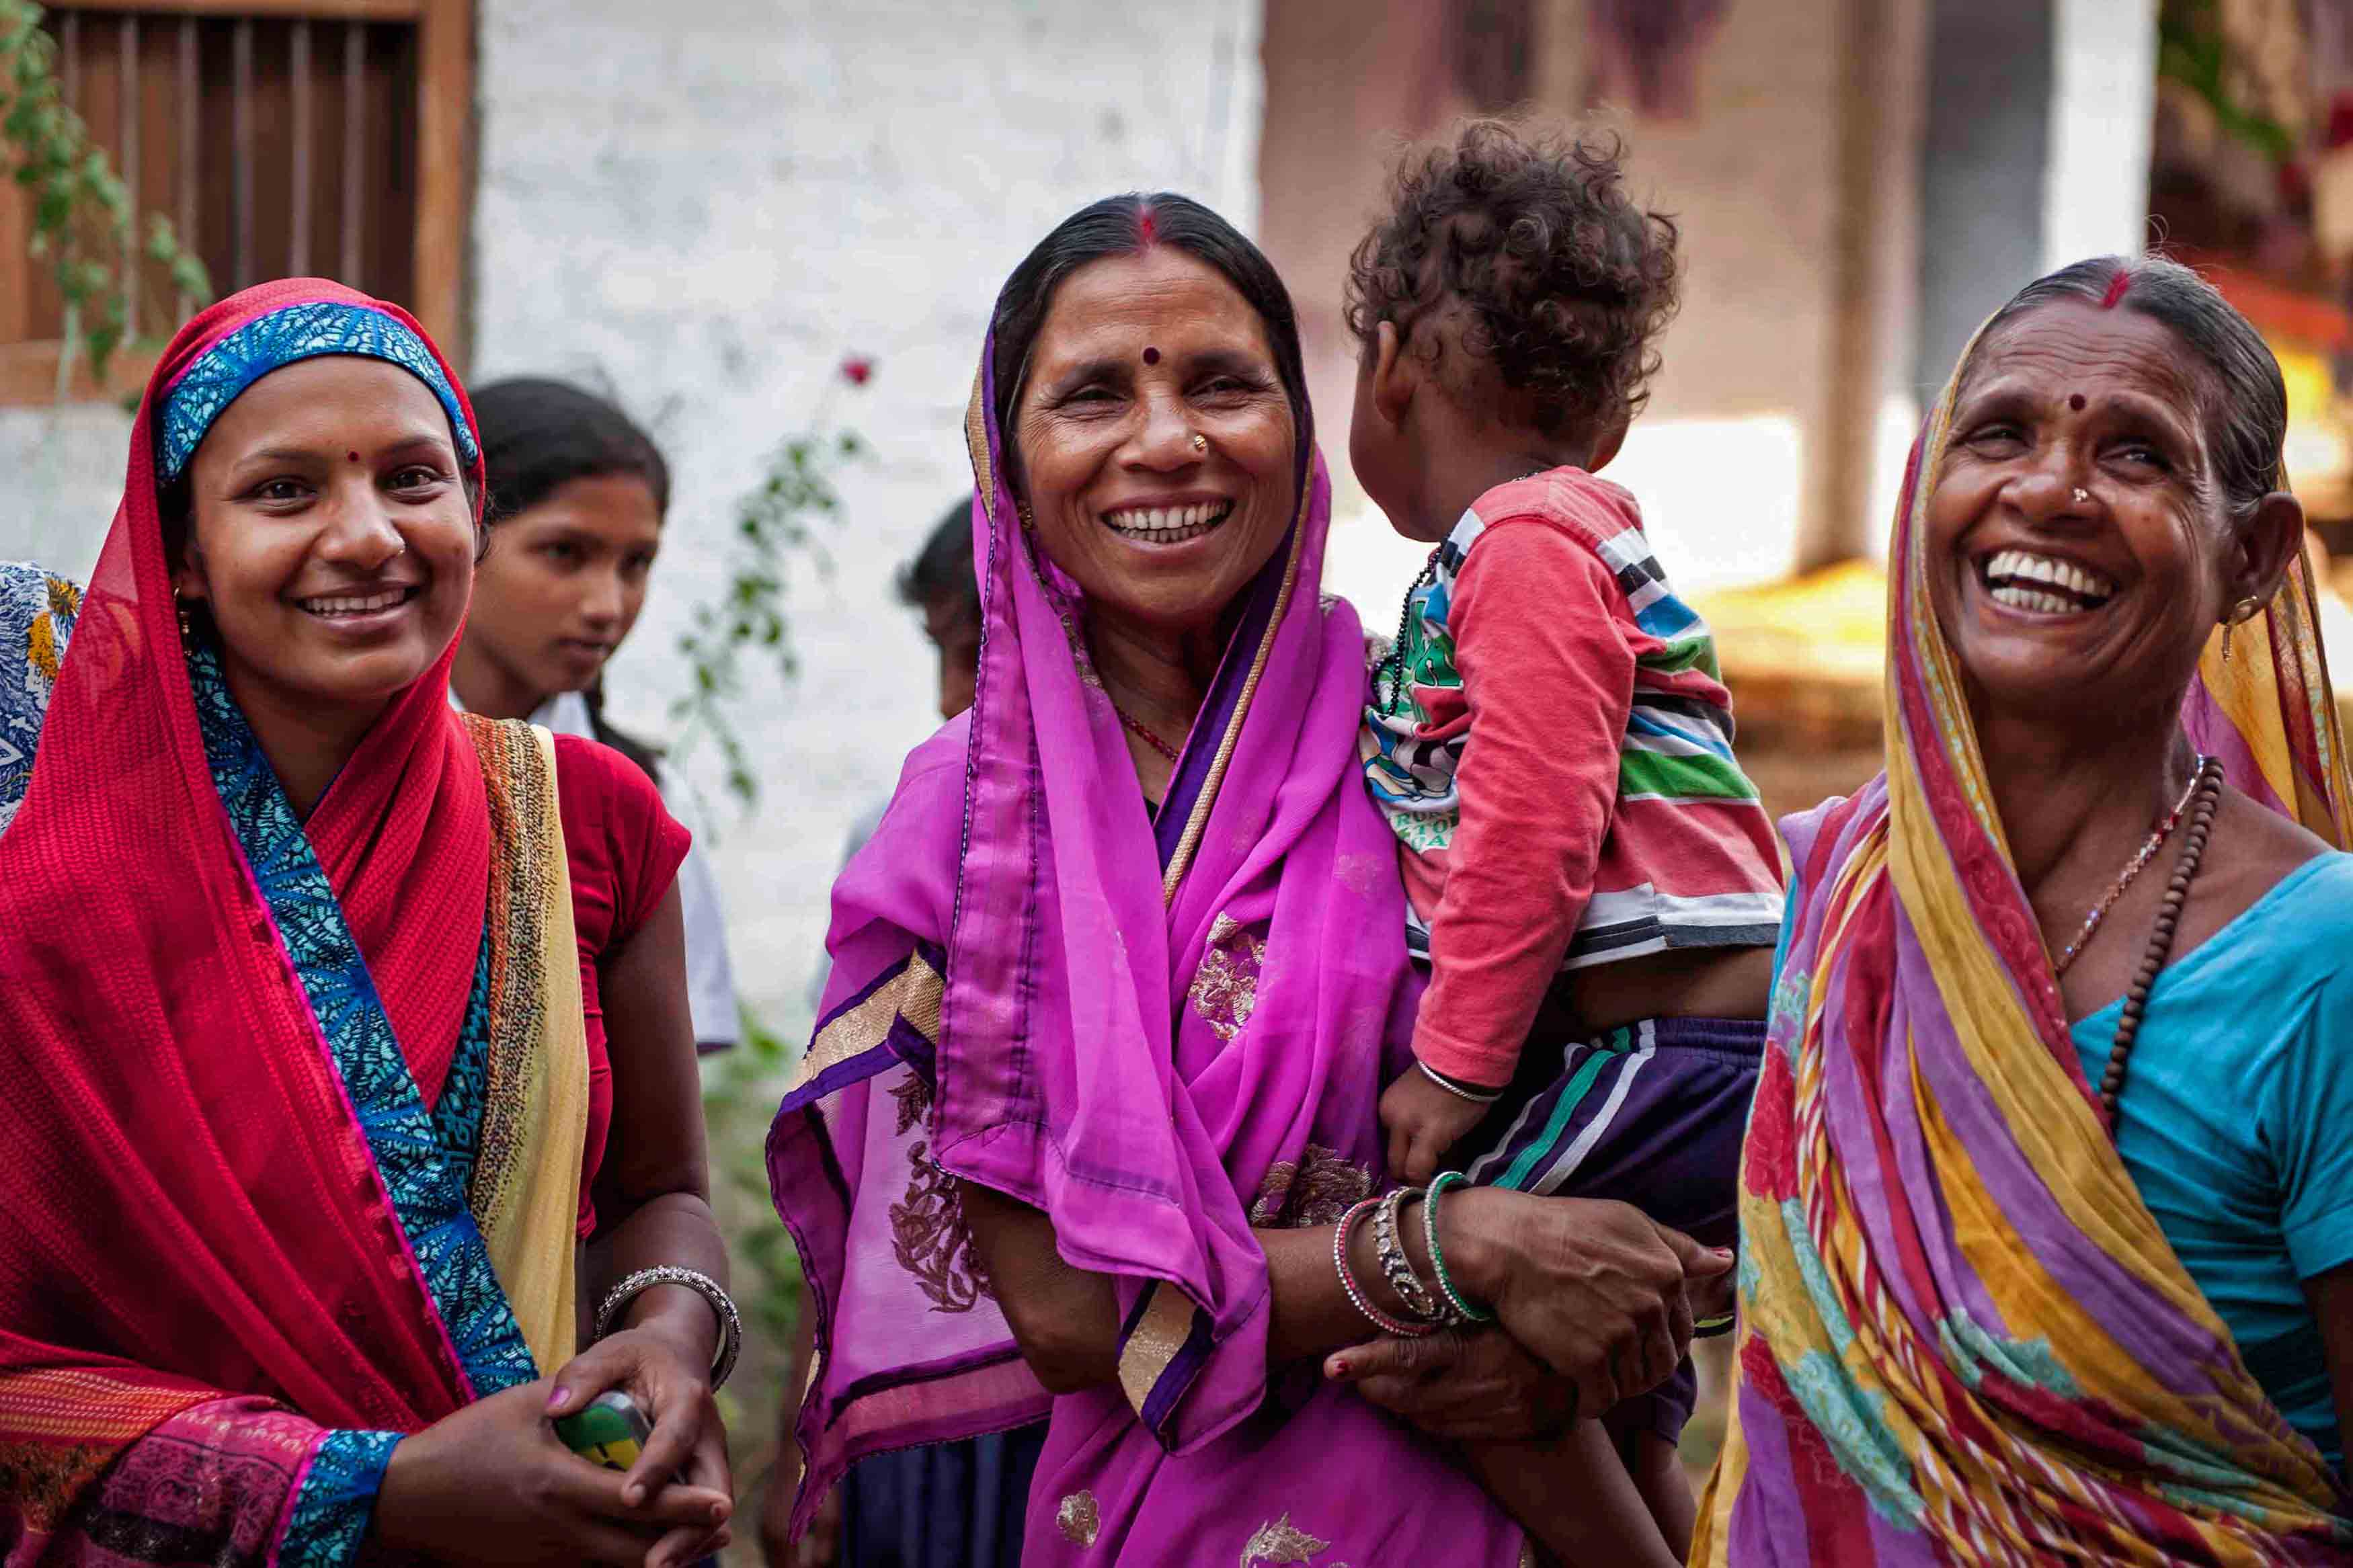
Digitalgreen
This NGO is a global development organization which works on uplifting the livelihoods of small farmers. They began as a project at Microsoft Research and evolved into an independent NPO which partners with global tech leaders and uses data analytics to improve the condition of unskilled farmers below the poverty line. They use a customized data collecting service COCO (connect online and connect offline) method. This eliminates the hurdles which come with lack of connectivity in rural areas. The data can be updated and used offline as well. They have built an analytics dashboard on CoCo database. This is an open source platform and can be used by anyone interested in making an impact with tech. With a database of over 5000 videos, Digital Green plans on implementing recommendation engines based predictive analytics models.
Data visualization tools
🫶
Microsoft Power BI
A user-friendly business analytics tool for visualizing and sharing insights from data. It offers interactive reports, dashboards, and seamless integration with other Microsoft services, making it a comprehensive solution for data analysis.
📈
Tableau
A free and user-friendly data visualization tool. It enables users to create and share interactive charts, graphs, and dashboards with a global community, making data storytelling accessible and engaging.
🗃️
Infogram
A web-based data visualization tool designed for creating interactive and visually appealing infographics, charts, and maps. With a variety of templates and customization options, it enables users to communicate complex information in a compelling manner.
🗃️
Alteryx
A streamlined data analytics platform that simplifies data preparation, blending, and analysis. It provides a user-friendly interface for tasks like data cleansing and predictive analytics, allowing data professionals to accelerate their analysis workflows.
Partner With Us

✨ Custom Solutions
Tailored applications to meet your specific NGO needs.

📈 Training and Support
Equip your team with the knowledge to thrive in the digital era.

🤝 Consultation Services
Personalized guidance for effective implementation.
Ready to Transform your NGO?
Who said change required a tech wizard? Ditch the complexities. Low-code, no-code solutions offer power without the programmer. Transform your nonprofit's impact with ease.

FAQs
1. Why is data analysis important for NGOs?
Data analysis helps NGOs make informed decisions, allocate resources effectively, measure program impact, and enhance overall transparency. It transforms raw data into actionable insights for strategic planning.
2. What are the key benefits of data visualization for NGOs?
Data visualization simplifies complex information, making it easier to communicate insights. It enhances stakeholder engagement, facilitates transparent reporting, and supports data-driven storytelling for effective advocacy.
3. How can NGOs get started with data analysis?
NGOs can start by defining clear goals, collecting relevant data, and exploring user-friendly tools like Microsoft Power BI or Tableau Public. Training staff on basic data analysis techniques is also crucial.
4. What are some common challenges NGOs face in data analysis and visualization?
Challenges may include lack of data literacy, limited resources for advanced tools, and ensuring data accuracy. Training staff, seeking partnerships, and gradually adopting more sophisticated tools can help address these challenges.
5. Is it necessary for NGOs to hire data analysts for effective data analysis?
While having dedicated data analysts is beneficial, NGOs can also empower existing staff through training programs. Many user-friendly tools allow individuals with varying levels of expertise to perform basic data analysis and visualization.
6. Can NGOs use data analysis for donor engagement and fundraising?
Yes, NGOs can leverage data analysis to demonstrate the impact of their projects, create compelling fundraising campaigns, and personalize donor engagement. Visualizing success stories and outcomes enhances donor trust and support.
7. Which data visualization tools are suitable for NGOs with limited resources?
NGOs with limited resources can explore free tools like Tableau Public, Google Data Studio, or Infogram. These platforms offer user-friendly interfaces and templates for creating impactful visualizations without a significant cost.
8. What are some common challenges NGOs face in data analysis and visualization?
Challenges may include lack of data literacy, limited resources for advanced tools, and ensuring data accuracy. Training staff, seeking partnerships, and gradually adopting more sophisticated tools can help address these challenges.
9. How can NGOs effectively measure the impact of their programs through data analysis?
NGOs can define key performance indicators (KPIs), track progress over time, and analyze data to assess program effectiveness. Regular monitoring and evaluation processes enable continuous improvement based on data-driven insights.
10. How can NGOs ensure data accuracy when working with external partners or collaborators?
NGOs should establish data-sharing agreements, validate data quality before integration, and communicate clearly with partners about data expectations. Collaboration and transparency are key to maintaining data accuracy.
12. What ongoing support do you provide after implementation?
We offer ongoing support to ensure the success of your No-Code/Low-Code journey. This includes continuous assistance, updates, and access to our support team to address any queries or challenges you may encounter.

Join our community
In a world shaped by rapid advancements, leveraging technology within your NGO’s mission can catalyze unprecedented impact. Incorporating technology isn’t just an option; it’s a strategic imperative for maximizing your organization’s potential and transforming lives at an unprecedented scale.
A forum of discourse to learn, discuss and
leverage technology for impact
An initiative by
HackforChange Foundation